
Category:Data visualization
English: Data visualization is the study of the visual representation of data, defined as information which has been abstracted in some schematic form, including attributes or variables for the units of information.
| To display all parents click on the "▶": |
creation and study of the visual representation of data | |||||
| Upload media | |||||
| Instance of | |||||
|---|---|---|---|---|---|
| Subclass of |
| ||||
| Part of |
| ||||
| Said to be the same as | statistical graphics | ||||
| Partially coincident with |
| ||||
| |||||
Subcategories
This category has the following 35 subcategories, out of 35 total.
*
C
- Climate spirals (32 F)
D
- Data Structure Diagrams (75 F)
E
- Entity Explosion (10 F)
G
- André-Michel Guerry (1 P, 6 F)
I
K
M
- Most popular articles statistics (156 F)
O
- OSM Mapper (2 F)
P
- Luigi Perozzo (1 P, 1 F)
S
- Seismograms (193 F)
T
- Tempestry Project (7 F)
- Tree view (41 F)
- Twitter activity (15 F)
W
Media in category "Data visualization"
The following 200 files are in this category, out of 567 total.
(previous page) (next page)-

-

-
%2C_bubble_chart%2C_pie_chart_-_all_showing_same_data.svg/120px-20230606_Composite_of_bar_chart_(Sankey_diagram)%2C_bubble_chart%2C_pie_chart_-_all_showing_same_data.svg.png)
-
 2024TRS.png 796 × 575; 71 KB
-
 210205-Хүний-Хөгжлийн-Илтгэл-2020-товч-танилцуулга.pdf 1,239 × 1,752, 4 pages; 694 KB
-
 2дњеф.png 510 × 249; 96 KB
-
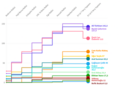
.png/120px-50_years_of_data_visualization_(black).png) 50 years of data visualization (black).png 2,408 × 1,226; 224 KB
50 years of data visualization (black).png 2,408 × 1,226; 224 KB
-
 50 years of datavisulization berengueres own work.png 508 × 193; 35 KB
-
 A Survey of Modern Business Science, 1921.jpg 635 × 1,047; 127 KB
-
 A visual representation of the "who owns my data" session at -wef.jpg 2,272 × 1,705; 930 KB
-
 Aaron Koblin - The Sheep Market at STRP.jpg 800 × 554; 268 KB
-
 All responses - Blue heatmap.png 1,138 × 704; 98 KB
-
 All responses - colour groups.png 1,532 × 707; 53 KB
-
 Amcharts.png 160 × 160; 9 KB
-
 Analyse Tübinger Studentendaten Projektbild.jpg 480 × 360; 37 KB
-
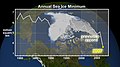 Annual Arctic Sea Ice Minimum.jpg 3,840 × 2,160; 539 KB
-
 Apprendre a l'ecole par la graphique - 3406496155.jpg 2,160 × 1,440; 1.05 MB
-
 Apprendre a l'ecole par la graphique - 3407304760.jpg 1,440 × 2,160; 1.11 MB
-
 Apprendre a l'ecole par la graphique - 3407304874.jpg 2,160 × 1,440; 1.13 MB
-
 Apprendre a l'ecole par la graphique.jpg 2,160 × 1,440; 1.08 MB
-
 Aquaculture iot water monitoring solution pentair eagle.io.jpg 915 × 448; 119 KB
-
 Artificial Worldviews Kim Albrecht Knowledge Close-up.png 2,000 × 999; 310 KB
-
 Artificial Worldviews Kim Albrecht Knowledge.png 1,080 × 1,080; 214 KB
-
 Artificial Worldviews Kim Albrecht Power Close-up.png 2,000 × 1,130; 296 KB
-
 Artificial Worldviews Kim Albrecht Power.png 1,080 × 1,080; 211 KB
-
 Artificial Worldviews Map Kim Albrecht.jpg 2,000 × 2,000; 826 KB
-
 Artificial Worldviews Mapping ChatGPT.jpg 1,200 × 1,200; 184 KB
-
 Atlas of Trove.jpg 3,264 × 2,254; 1.64 MB
-
.jpg/120px-AULA_MAGNA_PROFERIDA_PELO_SENHOR_GOVERNADOR%2C_AOS_ALUNOS_DA_FACULDADE_HUMANITAS_DE_CIÊNCIAS_MÉDICAS_DE_SÃO_JOSÉ_DOS_CAMPOS_(36873614425).jpg)
-
 Axis usage in information graphics 1.png 3,020 × 2,242; 345 KB
-
 Axis usage in information graphics.png 952 × 498; 38 KB
-
 Base64bin2txt.png 600 × 800; 91 KB
-
 Born in US-03.svg 512 × 691; 72 KB
-
 BRDC tree.svg 528 × 258; 3 KB
-
 Bsp Sek 2.png 1,228 × 705; 88 KB
-
 Bullet graph in R.png 510 × 258; 16 KB
-
 C.elegans-brain-network.jpg 1,024 × 768; 270 KB
-
.jpg/120px-Café_Filosófico_com_Alberto_Ogata_em_Sorocaba_(4193259576).jpg) Café Filosófico com Alberto Ogata em Sorocaba (4193259576).jpg 1,360 × 2,048; 1.76 MB
Café Filosófico com Alberto Ogata em Sorocaba (4193259576).jpg 1,360 × 2,048; 1.76 MB
-
 Career of Anna Karina.png 2,652 × 300; 40 KB
-
 Career of Philippe Katerine.png 2,652 × 240; 33 KB
-
 Carte Philosophique figurant la Population de la France.jpg 10,064 × 7,786; 13.47 MB
-
 Carte statistique de la France électorale 1839.jpg 7,761 × 6,197; 8.91 MB
-
.jpg/120px-Cathédrales_en_France_(DROM_inclus).jpg) Cathédrales en France (DROM inclus).jpg 3,357 × 2,195; 340 KB
Cathédrales en France (DROM inclus).jpg 3,357 × 2,195; 340 KB
-
 Cellular deconvolution workflow.jpg 3,000 × 2,100; 874 KB
-
 Chabris2007a.svg 696 × 532; 43 KB
-
 ChainesYouTube DétailCatégorieMilitant.png 999 × 599; 67 KB
-
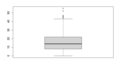 CMRS boxplot.png 770 × 475; 3 KB
-
 Code barre climat ou ou 'warming stripes Ed Hawkins ccbysa4.png 315 × 848; 15 KB
-
 Color Card F and C.jpg 2,448 × 2,448; 2.38 MB
-
 Control scenario output.jpg 1,056 × 816; 52 KB
-
 Correlation plot for Russia climate variables.png 916 × 549; 336 KB
-
.svg/120px-COVID-19_case_fatality_rate_vs._GDP_per_capita_(country-level_data).svg.png) COVID-19 case fatality rate vs. GDP per capita (country-level data).svg 741 × 459; 337 KB
COVID-19 case fatality rate vs. GDP per capita (country-level data).svg 741 × 459; 337 KB
-
 CSS3 taxonomy and status by Sergey Mavrody.svg 512 × 356; 26 KB
-
 CSS3 taxonomy and status-v2.png 1,384 × 1,380; 467 KB
-
 CVD-friendly sequential colormaps.png 861 × 603; 53 KB
-
 DARPA Big Data.jpg 1,500 × 968; 976 KB
-
 DARPA’s Topological Data Analysis program.tiff 608 × 363; 256 KB
-
.jpg/120px-DATA_(The_Remix_Lab).jpg) DATA (The Remix Lab).jpg 2,480 × 3,508; 3.58 MB
DATA (The Remix Lab).jpg 2,480 × 3,508; 3.58 MB
-
 Data display.png 829 × 525; 290 KB
-
 Data USA Homepage.png 2,518 × 1,422; 5.17 MB
-
.png/120px-Data_USA_Logo_(blue).png) Data USA Logo (blue).png 1,000 × 270; 32 KB
Data USA Logo (blue).png 1,000 × 270; 32 KB
-
 DataAppliedWeb.png 768 × 575; 312 KB
-
 Datacopia Chart Examples.png 1,602 × 854; 173 KB
-
 Datenvisualisierung.jpg 1,472 × 832; 519 KB
-
 DatSpec.jpg 1,268 × 625; 202 KB
-
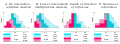
 Deaths in April 2018.png 2,471 × 3,298; 563 KB
-
 Deaths in February 2018.png 2,471 × 3,298; 561 KB
-
 Deaths in January 2018.png 2,471 × 3,298; 591 KB
-
 Deaths in July 2018.png 2,536 × 3,298; 561 KB
-
 Deaths in June 2018.png 2,471 × 3,298; 566 KB
-
 Deaths in March 2018.png 2,471 × 3,298; 571 KB
-
 Deaths in May 2018.png 2,471 × 3,298; 566 KB
-
.jpg/120px-Deception_Pass_Collection_Surge_2018_(cropped).jpg) Deception Pass Collection Surge 2018 (cropped).jpg 4,104 × 1,431; 2.11 MB
Deception Pass Collection Surge 2018 (cropped).jpg 4,104 × 1,431; 2.11 MB
-
 Deception Pass Collection Surge 2018.jpg 4,160 × 3,120; 3.82 MB
-
 Dendrogram-decorated.png 1,302 × 1,116; 196 KB
-
 Dendrogram-new.png 2,692 × 1,432; 400 KB
-
 Diamons Parallel Coordinates Plot.png 1,920 × 960; 1.99 MB
-
 Dispersión de Ventas de la Solución Past2Future Business Intelligence.jpg 1,547 × 868; 256 KB
-
 Distribution of Y.svg 510 × 378; 6 KB
-
 DuBois et al., 2021 Poster Violin Plot.png 993 × 835; 351 KB
-
 EBIT-Marge bis 2021.png 422 × 611; 194 KB
-
 ETH Libraries images in Wikimedia Commons pages.png 4,053 × 2,036; 95 KB
-
 Eth library-images usage in wikipedia.png 4,053 × 4,768; 236 KB
-
 Eth library-page views.png 10,600 × 4,763; 207 KB
-
 European eel aquaculture by country.png 1,373 × 764; 70 KB
-
 European greenhouse-emission 2012-2021.svg 500 × 750; 173 KB
-
.png/120px-Fatal_snake_bites_in_Australia_(dataviz).png) Fatal snake bites in Australia (dataviz).png 3,551 × 3,485; 633 KB
Fatal snake bites in Australia (dataviz).png 3,551 × 3,485; 633 KB
-
 Faulkner-Bennett Diagram 1.png 1,133 × 623; 35 KB
-
 Faulkner-Bennett Diagram 2.png 1,060 × 43; 2 KB
-
 Faulkner-Bennett Diagram 3.png 1,060 × 322; 11 KB
-
 Faulkner-Bennett Diagram 4.png 514 × 156; 5 KB
-
 Faulkner-Bennett Diagram 5.png 514 × 62; 2 KB
-
 Felicidade.png 8,064 × 6,048; 40.32 MB
-
 Feminism Word Cloud.png 1,920 × 1,093; 873 KB
-
 Ferret program.png 768 × 662; 54 KB
-
 Font size distribution.png 1,200 × 646; 24 KB
-
.jpg/120px-Food_by_line_weight_by_Lauren_Manning_(cropped).jpg) Food by line weight by Lauren Manning (cropped).jpg 3,649 × 2,708; 498 KB
Food by line weight by Lauren Manning (cropped).jpg 3,649 × 2,708; 498 KB
-
 Food by line weight by Lauren Manning.jpg 4,338 × 3,300; 1.55 MB
-
 GCH glam-page private.png 1,024 × 2,032; 349 KB
-
 GCH home.png 1,024 × 3,347; 1.27 MB
-
 GCH item.png 1,024 × 3,109; 642 KB
-
 Gephi 0.9.1 Network Analysis and Visualization Software.png 1,397 × 871; 566 KB
-
 Giacomin Carolina 10921839.svg 512 × 443; 102 KB
-
 Global Map of Oceanic Plate Age by Fabio Crameri.png 2,953 × 1,967; 4.45 MB
-
 Global population cartogram.png 8,192 × 3,131; 1.01 MB
-
 Gorgeous.png 910 × 652; 118 KB
-
 Graphic Diagrams The Graphic Visualization of Abstract Data - 35797779640.jpg 2,880 × 1,920; 826 KB
-
 Graphic Diagrams The Graphic Visualization of Abstract Data - 36020369302.jpg 2,880 × 1,920; 631 KB
-
 Graphic Diagrams The Graphic Visualization of Abstract Data - 36146908696.jpg 2,880 × 1,920; 746 KB
-
 Graphic Diagrams The Graphic Visualization of Abstract Data.jpg 2,880 × 1,920; 743 KB
-

-
 GreatCumbrianRun.png 1,365 × 767; 55 KB
-
 GTFS Transit Pattern of Madrid.png 3,500 × 3,500; 1.35 MB
-
 Guilt Intensity over coffee - sketch by Jess Klein.png 1,200 × 1,200; 213 KB
-
 Halbach Array.jpg 5,000 × 2,813; 1.72 MB
-
 Hand, bar and pie chart, dark.png 632 × 374; 13 KB
-
 Hand, bar and pie chart, light.png 632 × 382; 14 KB
-

-
-
 Horizon-chart example.svg 512 × 512; 85 KB
-
 Horizon-chart-from-area-chart.svg 512 × 107; 20 KB
-
 How much 1 million buys you in Hawaii and San Francisco by Eric Nakagawa.png 1,081 × 1,260; 32 KB
-
 How-big-is-a-petabyte-chart-infographic.jpg 600 × 1,260; 204 KB
-
 HTML5 APIs and related technologies taxonomy and status.svg 512 × 345; 12 KB
-
 HTML5 APIs and related technologies.svg 895 × 615; 36 KB
-
 HTML5-APIs-and-related-technologies-by-Sergey-Mavrody.png 1,778 × 1,227; 334 KB
-
.jpg/120px-Hurricane_Sergio_QuikSCAT_(2006).jpg) Hurricane Sergio QuikSCAT (2006).jpg 737 × 982; 911 KB
Hurricane Sergio QuikSCAT (2006).jpg 737 × 982; 911 KB
-
 Il canone TV in Europa.jpg 1,687 × 1,193; 367 KB
-
 Image upload heatmap commons kolkata.jpg 1,279 × 891; 136 KB
-
 Immigration borders-02.svg 512 × 410; 49 KB
-
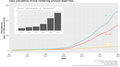 Increasing trend of discussing pronouns in one's social media bio.png 3,600 × 2,025; 114 KB
-
.jpg/120px-Infografico_Indústrias_(1325837184).jpg) Infografico Indústrias (1325837184).jpg 1,093 × 928; 318 KB
Infografico Indústrias (1325837184).jpg 1,093 × 928; 318 KB
-
.svg/120px-Infographic_on_the_flow_of_Wikidata_(for_offWiki_usage).svg.png) Infographic on the flow of Wikidata (for offWiki usage).svg 745 × 1,053; 824 KB
Infographic on the flow of Wikidata (for offWiki usage).svg 745 × 1,053; 824 KB
-
.svg/120px-Infographic_on_the_flow_of_Wikidata_(for_onWiki_usage).svg.png) Infographic on the flow of Wikidata (for onWiki usage).svg 745 × 1,053; 812 KB
Infographic on the flow of Wikidata (for onWiki usage).svg 745 × 1,053; 812 KB
-
 Integrated Genome Browser version 9.1.0 home screen.png 1,165 × 720; 290 KB
-
 Interactions.svg 1,134 × 416; 20 KB
-
 Iscore europe.png 3,018 × 3,122; 517 KB
-
 Islington Libraries total annual opening hours, by year.png 2,420 × 1,448; 145 KB
-
 Jofish and Whereabouts Clock Visualization.jpg 450 × 800; 64 KB
-
 Jugendorchester Gersthofen JUGGE Ausbildungskonzept.png 940 × 529; 121 KB
-
.jpg/120px-Julia_Demchuk_2020_(2).jpg) Julia Demchuk 2020 (2).jpg 1,986 × 740; 85 KB
Julia Demchuk 2020 (2).jpg 1,986 × 740; 85 KB
-
 Kamila B. Richter - Emporium Spirit, Ideal Limit, 2005.jpg 9,505 × 6,510; 5.56 MB
-
 Kaplan-Meyer plot.png 1,848 × 1,564; 479 KB
-
.jpg/120px-Karrie_Karahalois%27s_Conversation_Visualization_as_seen_at_Cornell_(439979658).jpg) Karrie Karahalois's Conversation Visualization as seen at Cornell (439979658).jpg 2,048 × 1,536; 531 KB
Karrie Karahalois's Conversation Visualization as seen at Cornell (439979658).jpg 2,048 × 1,536; 531 KB
-
 Kaveri Crater visualization in Tamil.png 1,920 × 1,080; 3.04 MB
-
 Kencf0618FacebookNetwork.jpg 960 × 960; 160 KB
-
 KibanaDevTools.png 1,359 × 571; 58 KB
-
 KibanaEnvironment.png 1,344 × 565; 89 KB
-
 Laman dan Menu untuk Mengubah Teks Pada Power Query.jpg 1,920 × 1,080; 317 KB
-
 Legend usage in information graphics 2.png 1,066 × 1,290; 140 KB
-
 Legend usage in information graphics.png 1,722 × 420; 75 KB
-

-
 Linha do tempo RITZ.jpg 533 × 193; 15 KB
-
 Linkedin maps data visualization.jpg 799 × 491; 209 KB
-
 Logo toucan toco.png 274 × 274; 8 KB
-
 LuminosoConceptCloud.png 1,443 × 1,091; 667 KB
-
 Lát cắt Sự vận hành của Vạn vật.png 8,000 × 6,532; 1.62 MB
-
.jpg/120px-Lämpötilapoikkeamat_1900-2016_(37507608404).jpg) Lämpötilapoikkeamat 1900-2016 (37507608404).jpg 1,840 × 1,440; 214 KB
Lämpötilapoikkeamat 1900-2016 (37507608404).jpg 1,840 × 1,440; 214 KB
-
 Légende de "Déploiements Opérationnels des Forces Armées Françaises".png 1,972 × 1,384; 315 KB
-
 Línea temporal de los presidentes municipales de Tuxcueca.jpg 6,259 × 1,346; 569 KB
-
 Línea temporal.jpg 6,259 × 1,596; 631 KB
-
 Línia patinatge sincronitzat.jpg 2,048 × 1,536; 411 KB
-
 Lösung der Poisson-Gleichung-Bild2.png 560 × 420; 32 KB
-
 Lümmel von der ersten Bank-Filme und Schauspieler.png 1,071 × 261; 22 KB
-
 Lümmel von der ersten Bank-Filme und Schauspieler2.png 1,086 × 262; 22 KB
-
 Lịch sử triết học.png 1,225 × 336; 22 KB
-
.png/120px-Lỗi_giao_diện_của_P.T.Đ_(100%25).png) Lỗi giao diện của P.T.Đ (100%).png 1,920 × 264; 94 KB
Lỗi giao diện của P.T.Đ (100%).png 1,920 × 264; 94 KB
-
.png/120px-Lỗi_giao_diện_của_P.T.Đ_(125%25).png) Lỗi giao diện của P.T.Đ (125%).png 1,920 × 231; 87 KB
Lỗi giao diện của P.T.Đ (125%).png 1,920 × 231; 87 KB
-
.png/120px-Lỗi_giao_diện_của_P.T.Đ_(150%25).png) Lỗi giao diện của P.T.Đ (150%).png 1,920 × 230; 68 KB
Lỗi giao diện của P.T.Đ (150%).png 1,920 × 230; 68 KB
-
.png/120px-Lỗi_giao_diện_của_P.T.Đ_(175%25).png) Lỗi giao diện của P.T.Đ (175%).png 1,920 × 441; 45 KB
Lỗi giao diện của P.T.Đ (175%).png 1,920 × 441; 45 KB
-
 Lời giải bài toán con rắn điền số.png 1,642 × 866; 487 KB
-
 Lời giải cấp độ lập trình máy tính - Trang 1.jpg 540 × 726; 140 KB
-
 Lời giải cấp độ lập trình máy tính - Trang 2.jpg 532 × 718; 137 KB
-

-
 M 184-2559-1-pb.png 520 × 390; 75 KB
-
 M MOLLLLL-1.png 1,183 × 242; 17 KB
-
 M vs c-command.jpg 131 × 294; 7 KB
-
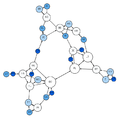
8_QTAIM.png/120px-M(CO)8_QTAIM.png) M(CO)8 QTAIM.png 2,000 × 2,000; 214 KB
M(CO)8 QTAIM.png 2,000 × 2,000; 214 KB
-
 Magic Rarities across Expansions.svg 512 × 288; 47 KB
-
Martin Wattenberg- Interview Excerpts from CLOUDS (2014).webm 25 min 24 s, 1,280 × 1,200; 369.07 MB
-
 MarzantowiczCOauthorsA.png 674 × 608; 115 KB
-
 MB WP Organisation.png 1,102 × 787; 234 KB
-
_Massachusetts_2012_ballot_measure_voting_results_by_municipality.svg/120px-Medical_marijuana_(Question_3)_Massachusetts_2012_ballot_measure_voting_results_by_municipality.svg.png)
-
 Monthly unique devices on Wikipedia in Q3 of FY23-24 by region.svg 2,029 × 1,324; 422 KB
-
 Monthly unique devices on Wikipedia in Q3 of FY23-24.svg 626 × 560; 57 KB
-
 Moreno Sociogram 1st Grade.png 568 × 568; 62 KB
-
 Moreno Sociogram 1st Grade.svg 568 × 568; 191 KB
-
 Moreno Sociogram 2nd Grade.png 525 × 525; 75 KB
-
 Moreno Sociogram 3rd Grade.png 701 × 701; 55 KB
-
 Moreno Sociogram 4th Grade.png 856 × 856; 50 KB
-
 Moreno Sociogram 5th Grade.png 1,000 × 1,000; 69 KB
-
 Moreno Sociogram 6th Grade.png 932 × 932; 68 KB
-
 Moreno Sociogram 7th Grade.png 813 × 813; 55 KB
-
 Moreno Sociogram 8th Grade.png 874 × 874; 89 KB
-
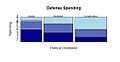 Mosaic plot defense spending example.jpg 596 × 310; 41 KB
-
 Mount Everest Climbers Timeline01.svg 512 × 406; 431 KB
-
 Mpemba-two-water-probes.png 617 × 403; 18 KB
-
 Mtcars Parallel Coordinates & Categories.png 1,920 × 910; 851 KB
-
 Muz i zena.jpg 414 × 270; 18 KB
-
 Natural-Haversine 4-place Table.pdf 1,752 × 1,239, 18 pages; 51 KB


,_bubble_chart,_pie_chart_-_all_showing_same_data.svg)


.png)


.jpg)


.jpg)


.jpg)


.svg)


.jpg)


.png)


.jpg)


.jpg)


.jpg)
.svg)
.svg)


.jpg)


.jpg)


8_QTAIM.png)


_Massachusetts_2012_ballot_measure_voting_results_by_municipality.svg)


.png)
.jpg)
.jpg)
.png)
.png)
.png)
.png)